---
title: "Monitors"
description: "Watch device metrics on a schedule and raise alerts when conditions trip."
icon: "wave-pulse"
---
> **For AI agents:** the complete documentation index is at [llms.txt](/llms.txt). Append `.md` to any page URL for its markdown version.
A **Monitor** is a scheduled rule that evaluates device metrics. On each tick it pulls the
configured metrics over a lookback window, computes any expressions you defined, and checks
your alert conditions. When a condition trips, the monitor fires the integrations attached to
that alert.
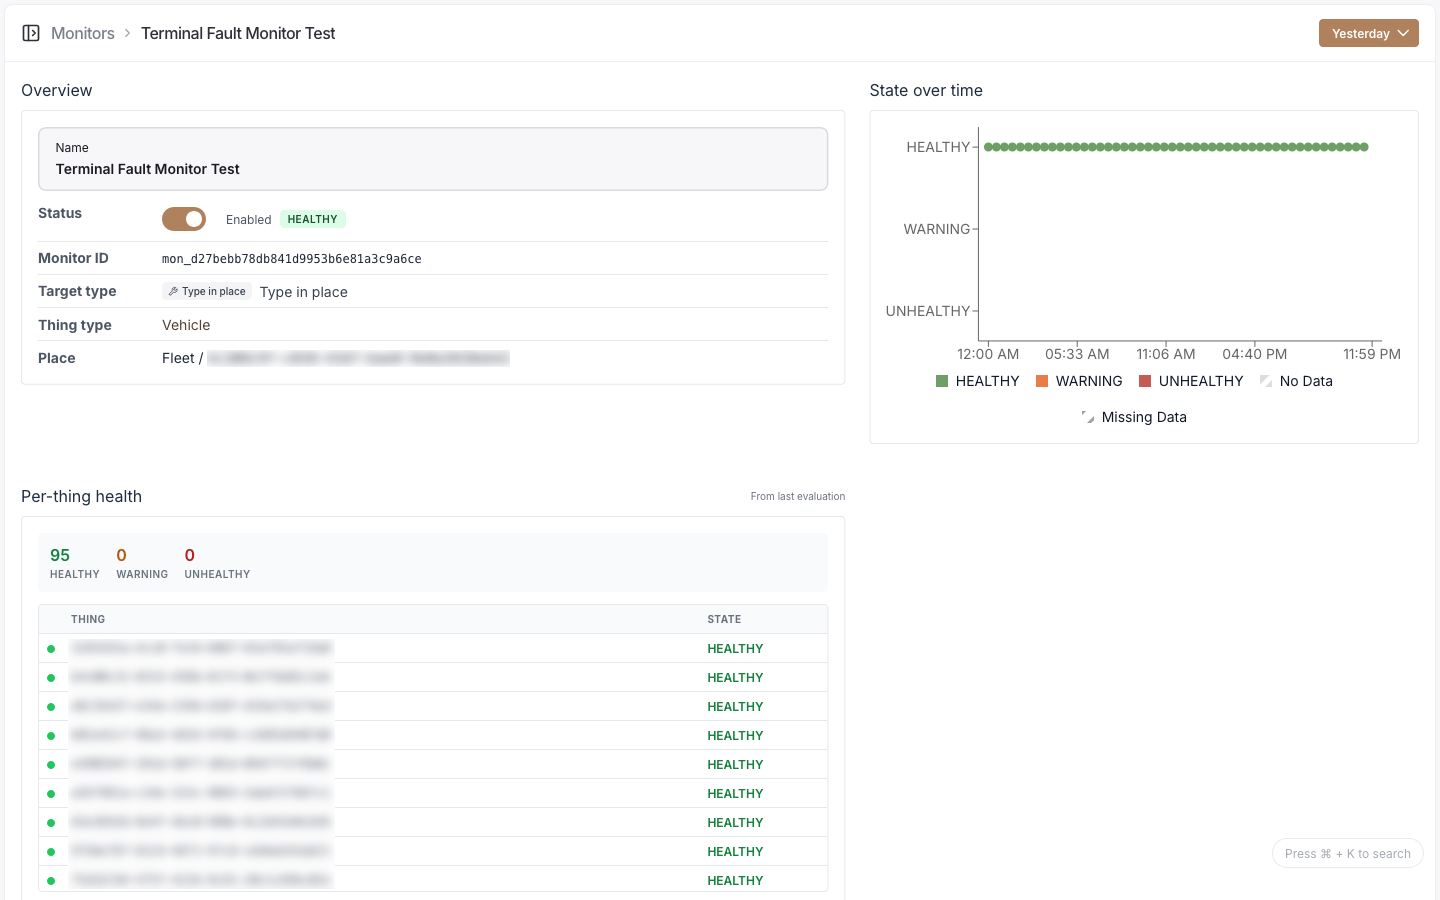
Each monitor rolls up to two independent states: a **health state** and a **data state**.
 ## Monitors and alerts
Alerts aren't separate objects. A monitor holds a list of alert configurations, and each
evaluation emits alert events inline. The alerts you see on a device, site, or fleet are
read-only views of those events, filtered to the ones currently tripped. An alert id uses the
`alt_` prefix.
You can see all the monitors in your organization and filter them. Creating a monitor walks you
through picking a target, setting a schedule, choosing metrics, optionally defining variables,
and adding alerts. From a monitor you can edit it, enable or disable it, view per-device health
and charts over a time range, edit its membership, and delete it.
## Configuration
### Target
Pick what the monitor watches.
| Target type | Watches |
|-------------|---------|
| `SINGLE_THING` | One device |
| `ALL_THINGS_OF_TYPE_IN_PLACE` | Every device of a type within a site or fleet |
| `ALL_THINGS_OF_TYPE` | Every device of a type, org-wide |
| `EXPLICIT_LIST` | A hand-picked list of devices of one type |
| `ALL_THINGS_AT_PLACE` | Every device at a site or fleet (any type) |
Plus a **monitor name** (required, up to 80 characters).
### Schedule
| Field | Options |
|-------|---------|
| Frequency | `1m`, `2m`, `5m`, `10m`, `12m`, `15m`, `30m`, `1h`, `2h`, `3h`, `6h`, `12h`, `1d` |
| Lookback period | Same set |
Lookback is capped relative to frequency, so faster monitors look back over a shorter window.
### Metrics
Add one or more [metrics](/console/ontology) to pull each tick. For each metric, choose how to
handle gaps:
| Missing-data behavior | Effect |
|-----------------------|--------|
| `NO_INFILL` | Leave gaps as missing |
| `INFILL_ZERO` | Fill gaps with zero |
| `INFILL_LAST_VALUE` | Carry the last known value forward |
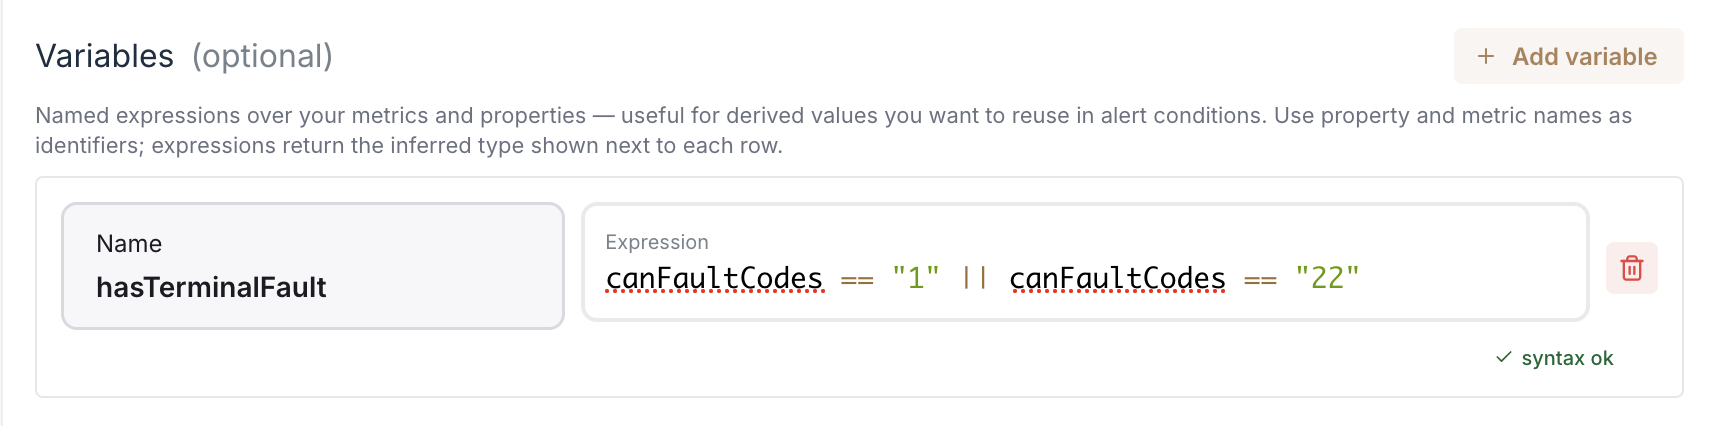
### Variables (optional)
Named expressions computed from your metrics, reusable in alert conditions. Each has a unique
name and an expression (up to 2000 characters). Expressions are validated live, with a badge
showing the inferred type.
## Monitors and alerts
Alerts aren't separate objects. A monitor holds a list of alert configurations, and each
evaluation emits alert events inline. The alerts you see on a device, site, or fleet are
read-only views of those events, filtered to the ones currently tripped. An alert id uses the
`alt_` prefix.
You can see all the monitors in your organization and filter them. Creating a monitor walks you
through picking a target, setting a schedule, choosing metrics, optionally defining variables,
and adding alerts. From a monitor you can edit it, enable or disable it, view per-device health
and charts over a time range, edit its membership, and delete it.
## Configuration
### Target
Pick what the monitor watches.
| Target type | Watches |
|-------------|---------|
| `SINGLE_THING` | One device |
| `ALL_THINGS_OF_TYPE_IN_PLACE` | Every device of a type within a site or fleet |
| `ALL_THINGS_OF_TYPE` | Every device of a type, org-wide |
| `EXPLICIT_LIST` | A hand-picked list of devices of one type |
| `ALL_THINGS_AT_PLACE` | Every device at a site or fleet (any type) |
Plus a **monitor name** (required, up to 80 characters).
### Schedule
| Field | Options |
|-------|---------|
| Frequency | `1m`, `2m`, `5m`, `10m`, `12m`, `15m`, `30m`, `1h`, `2h`, `3h`, `6h`, `12h`, `1d` |
| Lookback period | Same set |
Lookback is capped relative to frequency, so faster monitors look back over a shorter window.
### Metrics
Add one or more [metrics](/console/ontology) to pull each tick. For each metric, choose how to
handle gaps:
| Missing-data behavior | Effect |
|-----------------------|--------|
| `NO_INFILL` | Leave gaps as missing |
| `INFILL_ZERO` | Fill gaps with zero |
| `INFILL_LAST_VALUE` | Carry the last known value forward |
### Variables (optional)
Named expressions computed from your metrics, reusable in alert conditions. Each has a unique
name and an expression (up to 2000 characters). Expressions are validated live, with a badge
showing the inferred type.
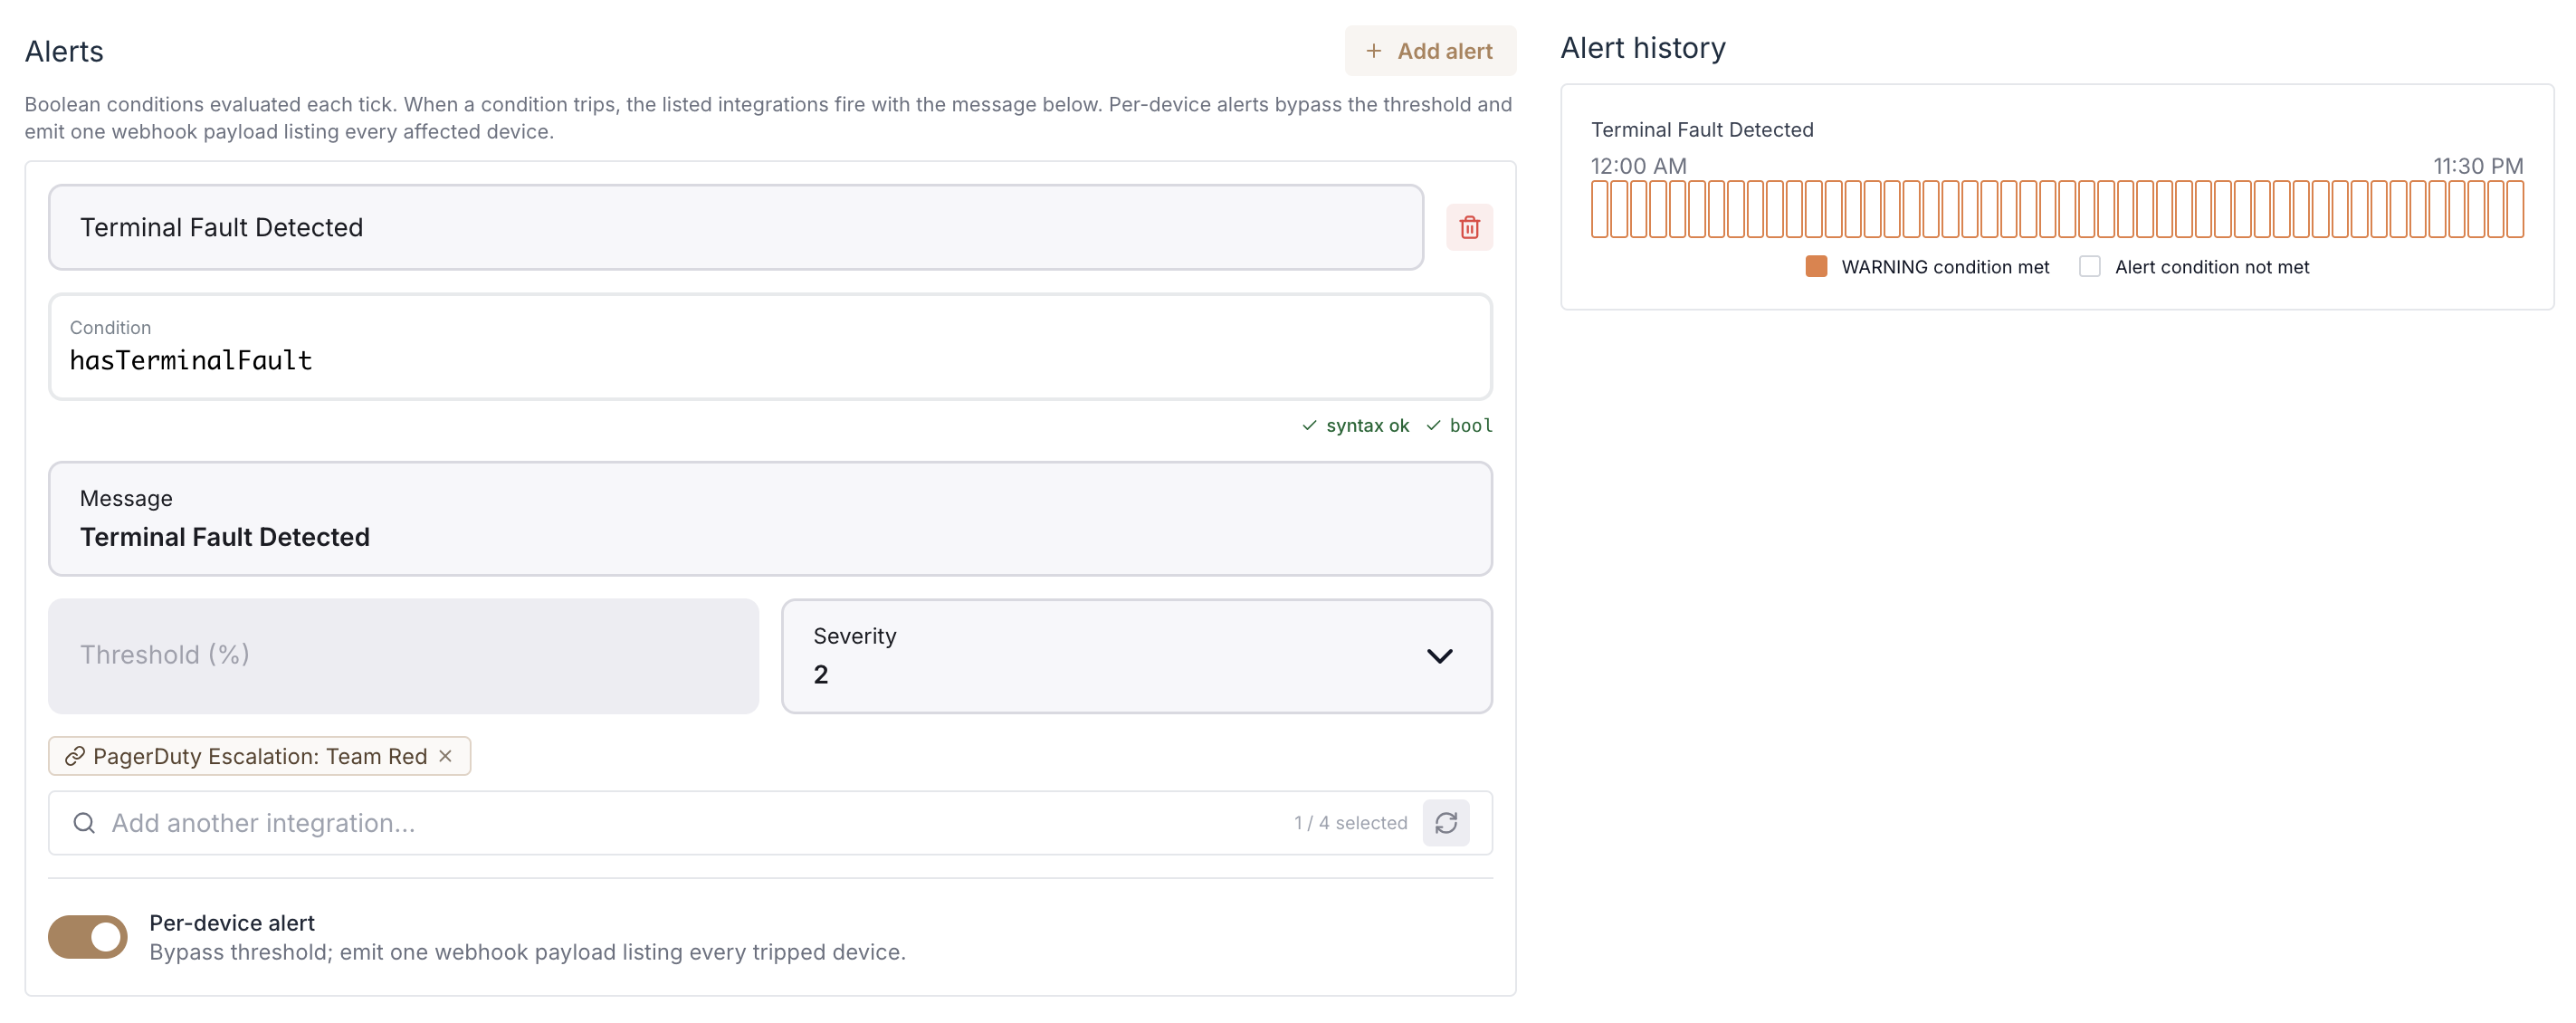
 ### Alerts
Conditions are written as expressions, not picked from operator dropdowns. Aggregations like
average, min, and max are written in the expression text (for example `avgSignal < 30`).
| Field | Type | Notes |
|-------|------|-------|
| Alert name | string | Required, unique, up to 80 chars |
| Condition | expression | Required; must evaluate to a boolean |
| Message | string | Required, up to 500 chars |
| Threshold percent | 0–100 | Share of devices that must trip; `0` or empty means any device |
| Severity | `0`–`9` | Required, unique per alert |
| Integrations | multi-select | Outbound integrations to fire (webhook, email, SMS, phone) |
| Per-device alert | toggle | One payload listing every affected device; webhook only, bypasses the threshold |
| Contributed state | `HEALTHY` / `WARNING` / `UNHEALTHY` | The health state this alert sets when tripped (default `WARNING`) |
### Alerts
Conditions are written as expressions, not picked from operator dropdowns. Aggregations like
average, min, and max are written in the expression text (for example `avgSignal < 30`).
| Field | Type | Notes |
|-------|------|-------|
| Alert name | string | Required, unique, up to 80 chars |
| Condition | expression | Required; must evaluate to a boolean |
| Message | string | Required, up to 500 chars |
| Threshold percent | 0–100 | Share of devices that must trip; `0` or empty means any device |
| Severity | `0`–`9` | Required, unique per alert |
| Integrations | multi-select | Outbound integrations to fire (webhook, email, SMS, phone) |
| Per-device alert | toggle | One payload listing every affected device; webhook only, bypasses the threshold |
| Contributed state | `HEALTHY` / `WARNING` / `UNHEALTHY` | The health state this alert sets when tripped (default `WARNING`) |
 ## States
### Health state
| State | Meaning |
|-------|---------|
| `HEALTHY` | No alert condition tripped |
| `WARNING` | A warning-level condition tripped |
| `UNHEALTHY` | An unhealthy-level condition tripped |
### Data state
| State | Meaning |
|-------|---------|
| `COMPLETE_DATA` | All expected data was present |
| `MISSING_DATA` | Some expected data was missing |
| `NO_DATA` | No data arrived |
### Enabled, disabled, auto-disabled
A monitor is **Enabled** or **Disabled** via a toggle.
The platform **auto-disables** a monitor when its target stops being valid: a metric is removed
from the type, the thing type or metric definition is deleted, or the place is deleted. A
banner shows the reason and time. Re-enable it with the toggle once the target is restored.
### Alert events
Each tick records whether the condition tripped. Alert events carry the contributed state
(`HEALTHY` / `WARNING` / `UNHEALTHY`) and the severity (`0`–`9`). The detail charts show
tripped versus not-tripped over time.
## API
Monitor management endpoints are **coming soon** to the v2 API. For now, manage monitors in
the console. A Place's monitor count is available through
`GET /v2/sites/{placeId}/monitor/count` and `GET /v2/fleets/{placeId}/monitor/count`.
## States
### Health state
| State | Meaning |
|-------|---------|
| `HEALTHY` | No alert condition tripped |
| `WARNING` | A warning-level condition tripped |
| `UNHEALTHY` | An unhealthy-level condition tripped |
### Data state
| State | Meaning |
|-------|---------|
| `COMPLETE_DATA` | All expected data was present |
| `MISSING_DATA` | Some expected data was missing |
| `NO_DATA` | No data arrived |
### Enabled, disabled, auto-disabled
A monitor is **Enabled** or **Disabled** via a toggle.
The platform **auto-disables** a monitor when its target stops being valid: a metric is removed
from the type, the thing type or metric definition is deleted, or the place is deleted. A
banner shows the reason and time. Re-enable it with the toggle once the target is restored.
### Alert events
Each tick records whether the condition tripped. Alert events carry the contributed state
(`HEALTHY` / `WARNING` / `UNHEALTHY`) and the severity (`0`–`9`). The detail charts show
tripped versus not-tripped over time.
## API
Monitor management endpoints are **coming soon** to the v2 API. For now, manage monitors in
the console. A Place's monitor count is available through
`GET /v2/sites/{placeId}/monitor/count` and `GET /v2/fleets/{placeId}/monitor/count`.