---
title: "Overview"
description: "The landing dashboard: fleet-wide health at a glance."
icon: "gauge"
---
> **For AI agents:** the complete documentation index is at [llms.txt](/llms.txt). Append `.md` to any page URL for its markdown version.
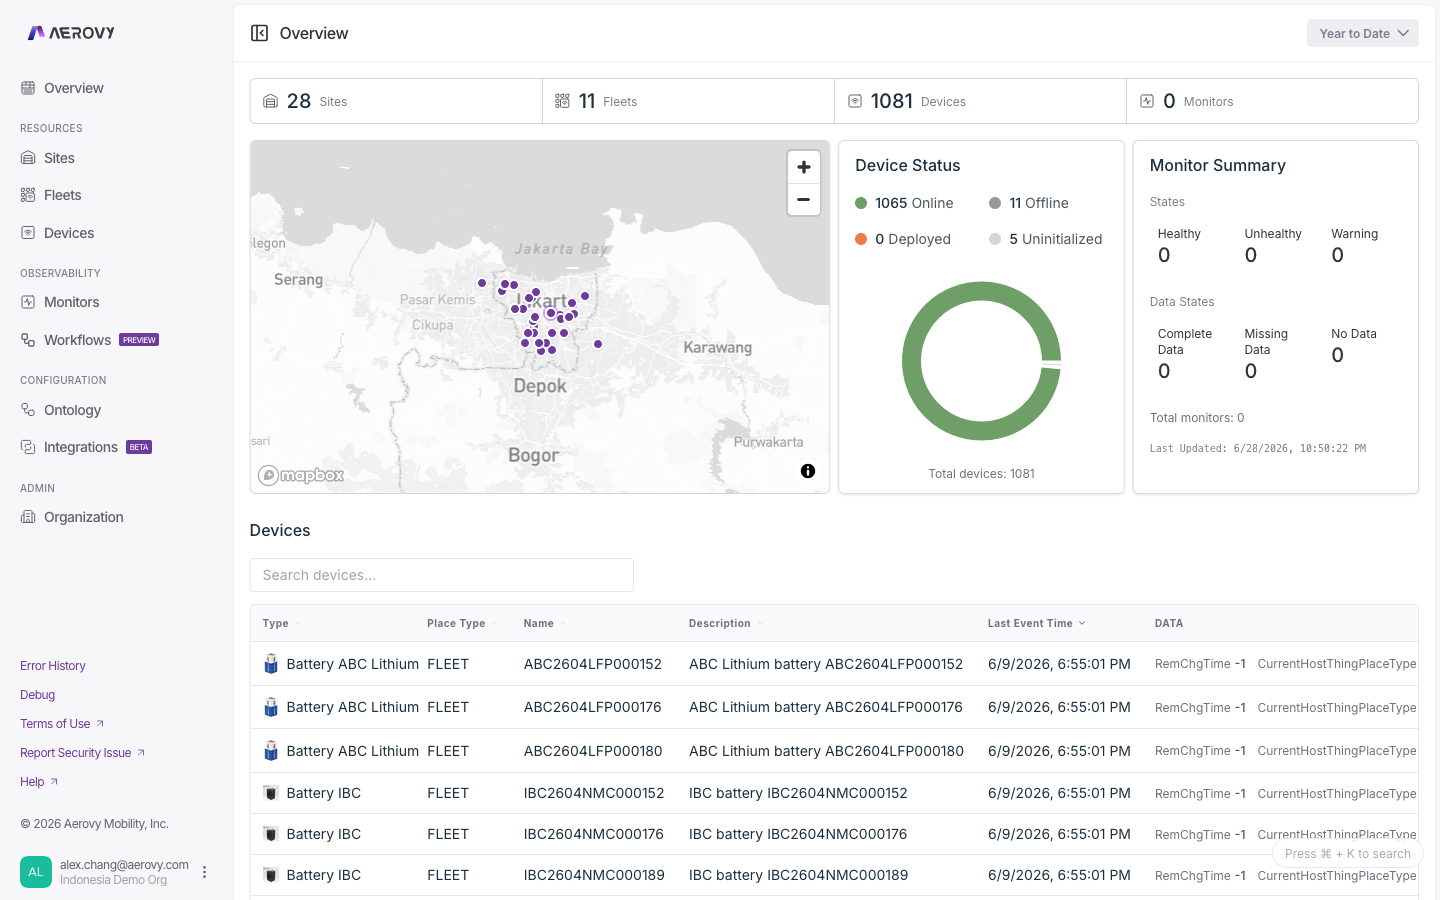
The **Overview** is the landing page of the console. It summarizes the health of everything in
your organization: counts of sites, fleets, devices, and monitors, the location of your sites
and fleets, a breakdown of devices by online state, monitor health and data coverage, and a
list of every device.
A time-range selector sets the window for device state and, where enabled, transaction volume.
 ## Configuration
### Time range
Sets the window for device state and transaction volume.
| Option | Meaning |
|--------|---------|
| Past Day | Last 24 hours |
| Today | Since midnight |
| Yesterday | The previous day |
| Past Week | Last 7 days (default) |
| Year to date | Since Jan 1 |
| Custom range | Pick start and end, with a **UTC** / **Local** timezone toggle |
### Devices table
Lists every device, sorted by most recent event first.
## States
### Device state
Each device resolves to one of four states from its last event time and reporting interval.
| State | Label in UI | Meaning |
|-------|-------------|---------|
| `online` | Online | Last event arrived within the reporting interval |
| `offline` | Offline | No event within the reporting interval |
| `unknown` | Deployed | No reporting interval set, so freshness can't be judged |
| `uninitialized` | Uninitialized | Device has never reported an event |
The reporting interval defaults to 60 minutes when the device doesn't define one. If device
data fails to load, every device falls back to **Deployed** (`unknown`).
### Monitor health
The monitor summary card rolls every monitor up into two independent dimensions.
**Health state**
| State | Meaning |
|-------|---------|
| `HEALTHY` | Condition is satisfied |
| `WARNING` | Condition is in a warning band |
| `UNHEALTHY` | Condition is breached |
**Data state**
| State | Meaning |
|-------|---------|
| `COMPLETE_DATA` | All expected data is present |
| `MISSING_DATA` | Some expected data is missing |
| `NO_DATA` | No data is arriving |
The card also shows the total monitor count and the time the summary was last calculated.
## API
The Overview only reads data (send your API key in the `X-Api-Key` header; a `read` scope
covers all of it).
- Device, site, and fleet counts come from the standard list endpoints (`GET /v2/things`,
`GET /v2/sites`, `GET /v2/fleets`) documented on the [Devices](/console/devices),
[Sites](/console/sites), and [Fleets](/console/fleets) pages.
- Per-device online/offline state derives from each device's last event time
(`GET /v2/things/{thingId}/latest-event-time`).
An org-wide monitor health and data-state summary endpoint is **coming soon** to the v2 API.
A Place's monitor count is available through `GET /v2/sites/{placeId}/monitor/count` and
`GET /v2/fleets/{placeId}/monitor/count`.
## Configuration
### Time range
Sets the window for device state and transaction volume.
| Option | Meaning |
|--------|---------|
| Past Day | Last 24 hours |
| Today | Since midnight |
| Yesterday | The previous day |
| Past Week | Last 7 days (default) |
| Year to date | Since Jan 1 |
| Custom range | Pick start and end, with a **UTC** / **Local** timezone toggle |
### Devices table
Lists every device, sorted by most recent event first.
## States
### Device state
Each device resolves to one of four states from its last event time and reporting interval.
| State | Label in UI | Meaning |
|-------|-------------|---------|
| `online` | Online | Last event arrived within the reporting interval |
| `offline` | Offline | No event within the reporting interval |
| `unknown` | Deployed | No reporting interval set, so freshness can't be judged |
| `uninitialized` | Uninitialized | Device has never reported an event |
The reporting interval defaults to 60 minutes when the device doesn't define one. If device
data fails to load, every device falls back to **Deployed** (`unknown`).
### Monitor health
The monitor summary card rolls every monitor up into two independent dimensions.
**Health state**
| State | Meaning |
|-------|---------|
| `HEALTHY` | Condition is satisfied |
| `WARNING` | Condition is in a warning band |
| `UNHEALTHY` | Condition is breached |
**Data state**
| State | Meaning |
|-------|---------|
| `COMPLETE_DATA` | All expected data is present |
| `MISSING_DATA` | Some expected data is missing |
| `NO_DATA` | No data is arriving |
The card also shows the total monitor count and the time the summary was last calculated.
## API
The Overview only reads data (send your API key in the `X-Api-Key` header; a `read` scope
covers all of it).
- Device, site, and fleet counts come from the standard list endpoints (`GET /v2/things`,
`GET /v2/sites`, `GET /v2/fleets`) documented on the [Devices](/console/devices),
[Sites](/console/sites), and [Fleets](/console/fleets) pages.
- Per-device online/offline state derives from each device's last event time
(`GET /v2/things/{thingId}/latest-event-time`).
An org-wide monitor health and data-state summary endpoint is **coming soon** to the v2 API.
A Place's monitor count is available through `GET /v2/sites/{placeId}/monitor/count` and
`GET /v2/fleets/{placeId}/monitor/count`.