Monitors
Watch device metrics on a schedule and raise alerts when conditions trip.
A Monitor is a scheduled rule that evaluates device metrics. On each tick it pulls the configured metrics over a lookback window, computes any expressions you defined, and checks your alert conditions. When a condition trips, the monitor fires the integrations attached to that alert.
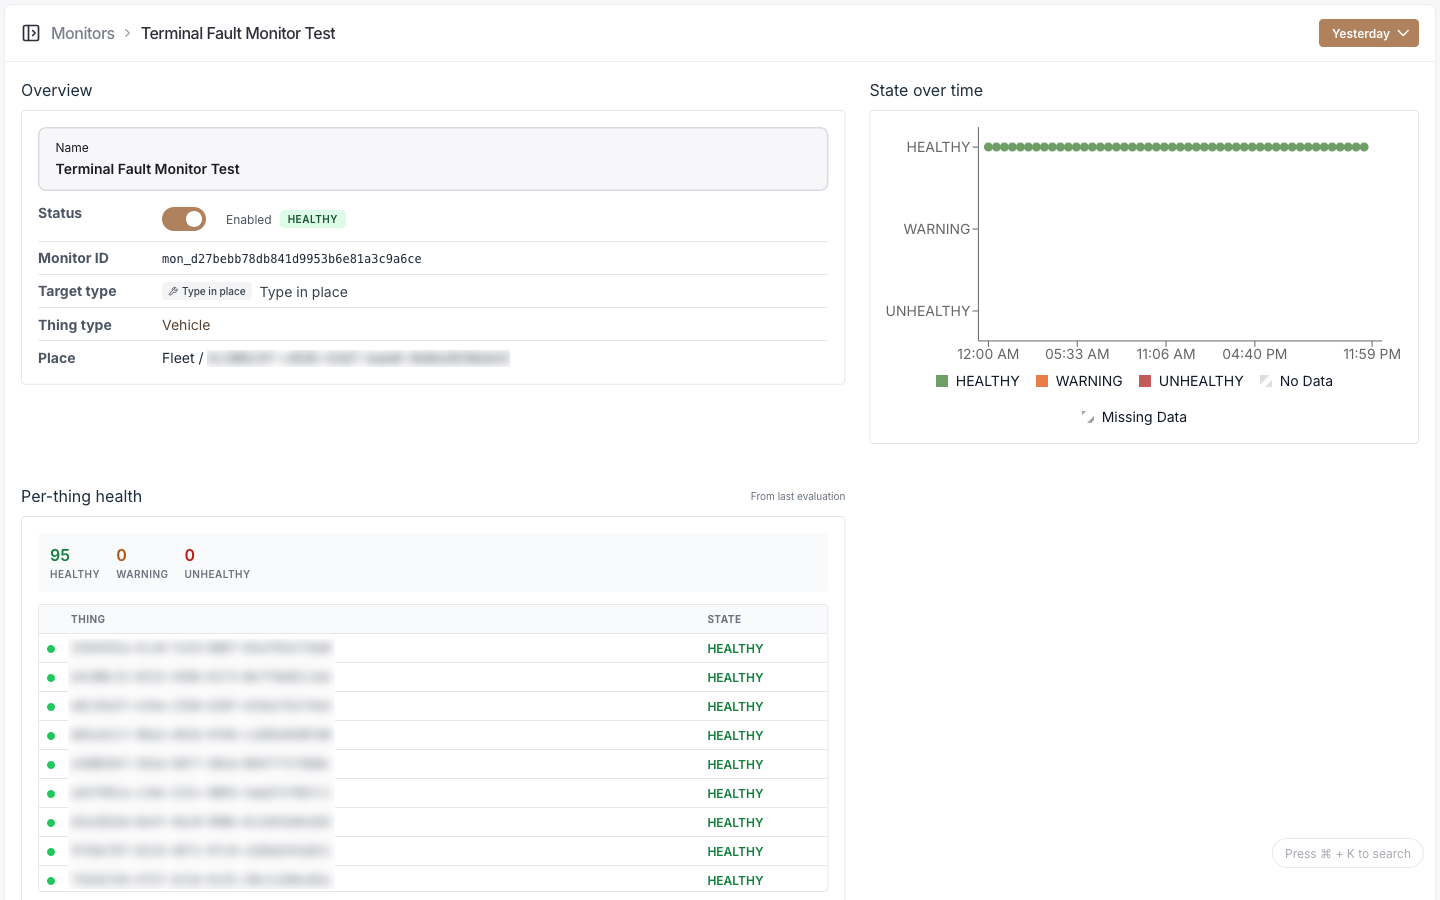
Each monitor rolls up to two independent states: a health state and a data state.
Monitors and alerts
Alerts aren't separate objects. A monitor holds a list of alert configurations, and each
evaluation emits alert events inline. The alerts you see on a device, site, or fleet are
read-only views of those events, filtered to the ones currently tripped. An alert id uses the
alt_ prefix.
You can see all the monitors in your organization and filter them. Creating a monitor walks you through picking a target, setting a schedule, choosing metrics, optionally defining variables, and adding alerts. From a monitor you can edit it, enable or disable it, view per-device health and charts over a time range, edit its membership, and delete it.
Configuration
Target
Pick what the monitor watches.
| Target type | Watches |
|---|---|
SINGLE_THING | One device |
ALL_THINGS_OF_TYPE_IN_PLACE | Every device of a type within a site or fleet |
ALL_THINGS_OF_TYPE | Every device of a type, org-wide |
EXPLICIT_LIST | A hand-picked list of devices of one type |
ALL_THINGS_AT_PLACE | Every device at a site or fleet (any type) |
Plus a monitor name (required, up to 80 characters).
Schedule
| Field | Options |
|---|---|
| Frequency | 1m, 2m, 5m, 10m, 12m, 15m, 30m, 1h, 2h, 3h, 6h, 12h, 1d |
| Lookback period | Same set |
Lookback is capped relative to frequency, so faster monitors look back over a shorter window.
Metrics
Add one or more metrics to pull each tick. For each metric, choose how to handle gaps:
| Missing-data behavior | Effect |
|---|---|
NO_INFILL | Leave gaps as missing |
INFILL_ZERO | Fill gaps with zero |
INFILL_LAST_VALUE | Carry the last known value forward |
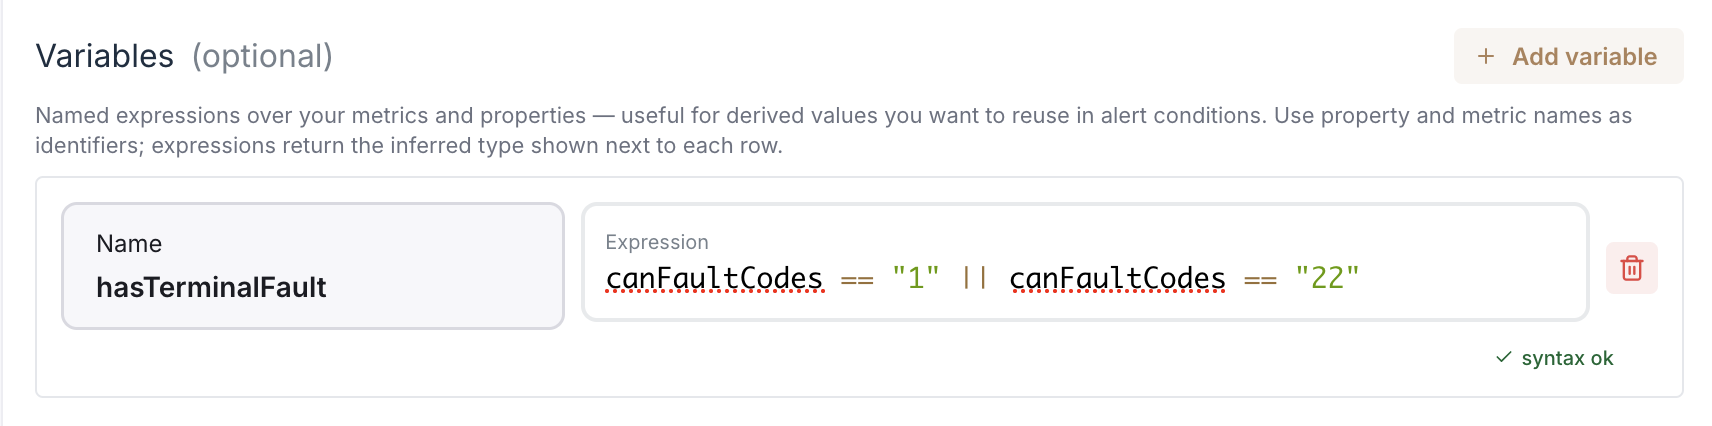
Variables (optional)
Named expressions computed from your metrics, reusable in alert conditions. Each has a unique name and an expression (up to 2000 characters). Expressions are validated live, with a badge showing the inferred type.
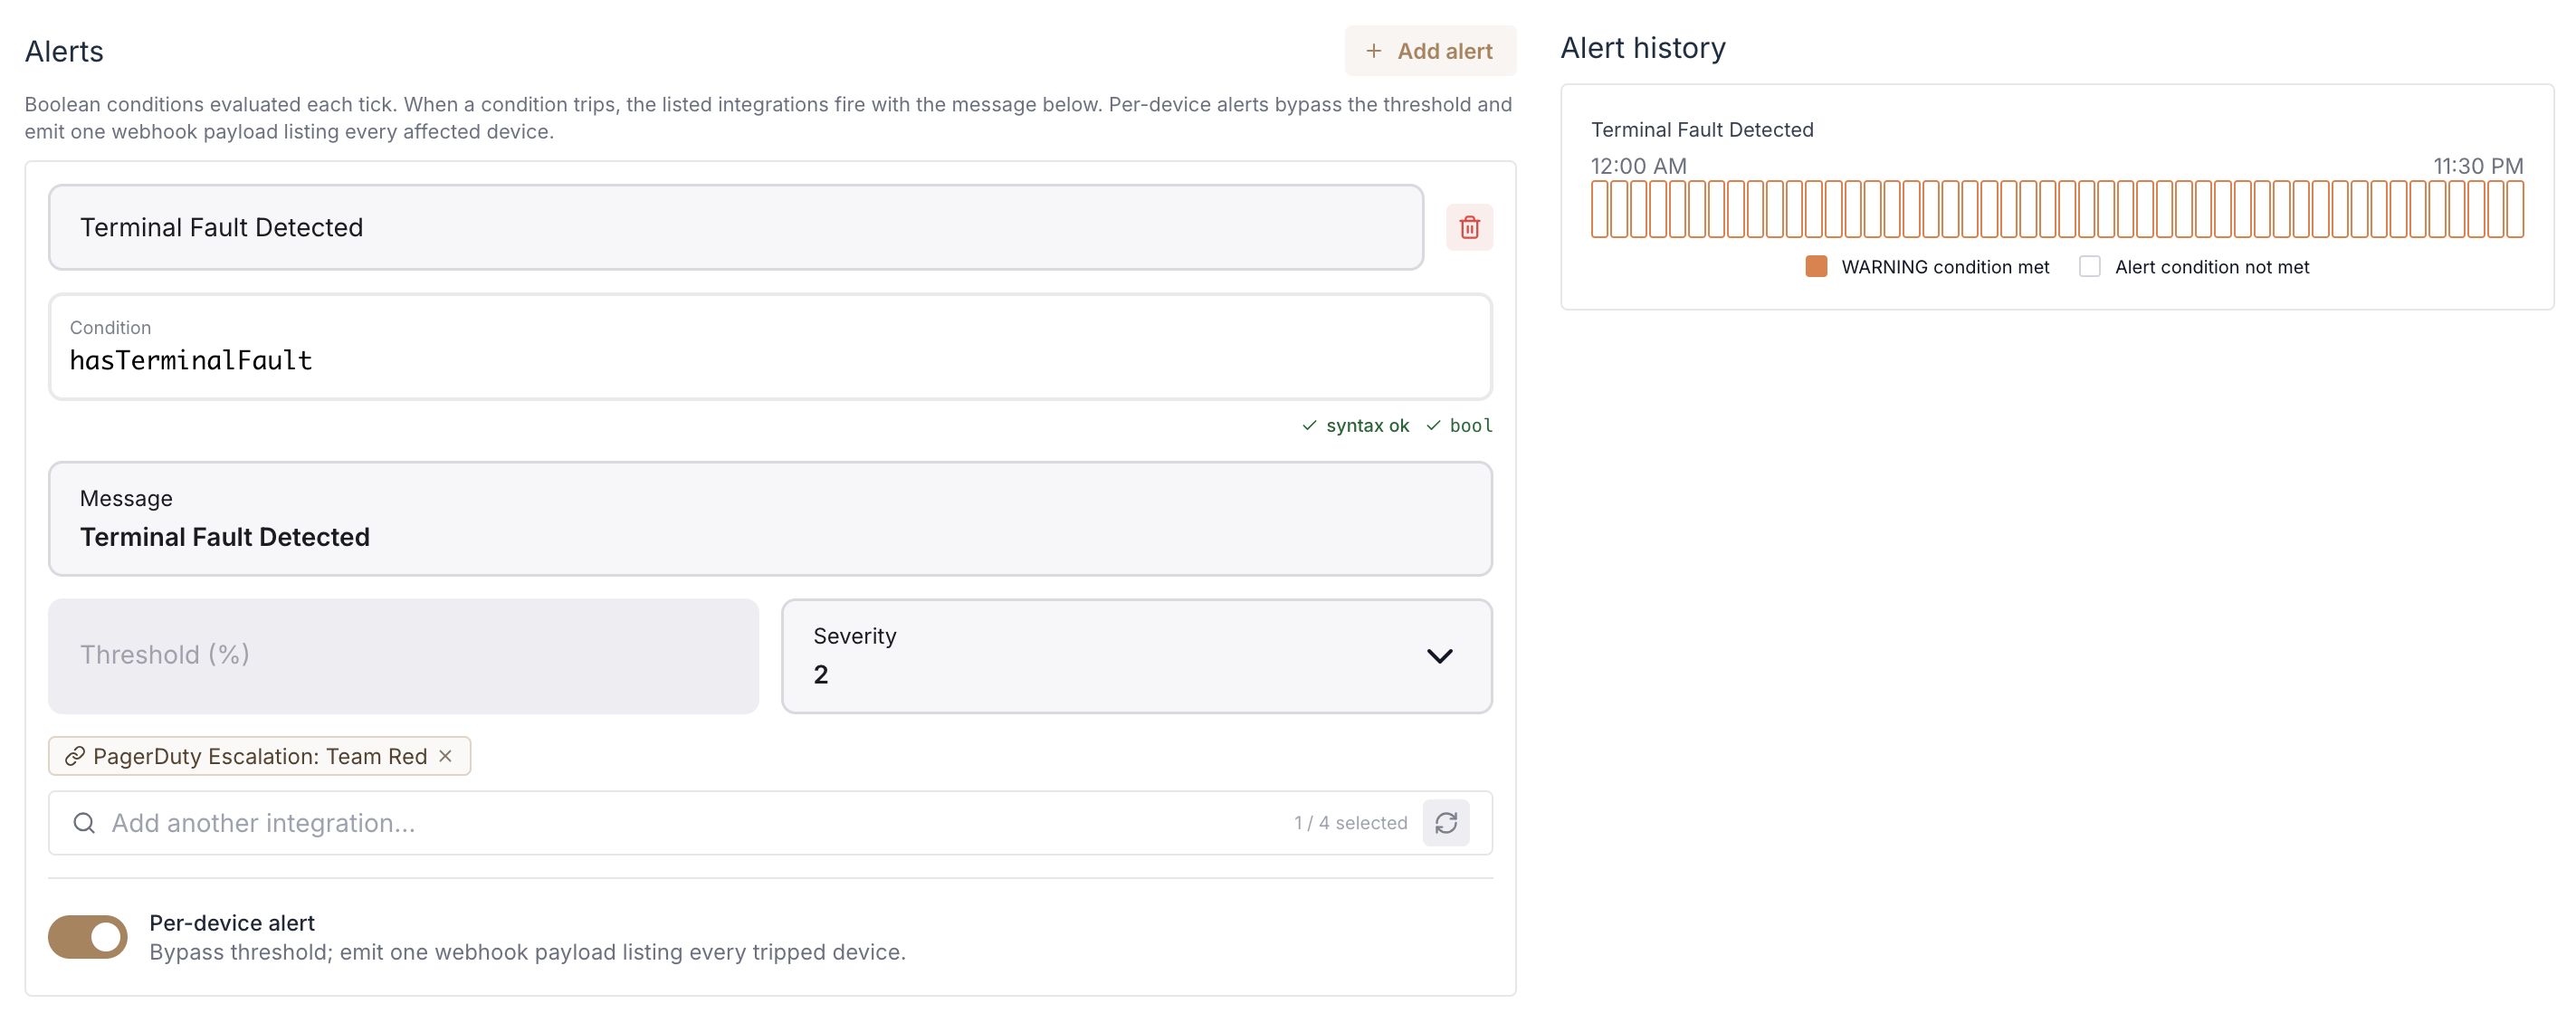
Alerts
Conditions are written as expressions, not picked from operator dropdowns. Aggregations like
average, min, and max are written in the expression text (for example avgSignal < 30).
| Field | Type | Notes |
|---|---|---|
| Alert name | string | Required, unique, up to 80 chars |
| Condition | expression | Required; must evaluate to a boolean |
| Message | string | Required, up to 500 chars |
| Threshold percent | 0–100 | Share of devices that must trip; 0 or empty means any device |
| Severity | 0–9 | Required, unique per alert |
| Integrations | multi-select | Outbound integrations to fire (webhook, email, SMS, phone) |
| Per-device alert | toggle | One payload listing every affected device; webhook only, bypasses the threshold |
| Contributed state | HEALTHY / WARNING / UNHEALTHY | The health state this alert sets when tripped (default WARNING) |
States
Health state
| State | Meaning |
|---|---|
HEALTHY | No alert condition tripped |
WARNING | A warning-level condition tripped |
UNHEALTHY | An unhealthy-level condition tripped |
Data state
| State | Meaning |
|---|---|
COMPLETE_DATA | All expected data was present |
MISSING_DATA | Some expected data was missing |
NO_DATA | No data arrived |
Enabled, disabled, auto-disabled
A monitor is Enabled or Disabled via a toggle.
The platform auto-disables a monitor when its target stops being valid: a metric is removed from the type, the thing type or metric definition is deleted, or the place is deleted. A banner shows the reason and time. Re-enable it with the toggle once the target is restored.
Alert events
Each tick records whether the condition tripped. Alert events carry the contributed state
(HEALTHY / WARNING / UNHEALTHY) and the severity (0–9). The detail charts show
tripped versus not-tripped over time.
API
Monitor management endpoints are coming soon to the v2 API. For now, manage monitors in
the console. A Place's monitor count is available through
GET /v2/sites/{placeId}/monitor/count and GET /v2/fleets/{placeId}/monitor/count.