Overview
The landing dashboard: fleet-wide health at a glance.
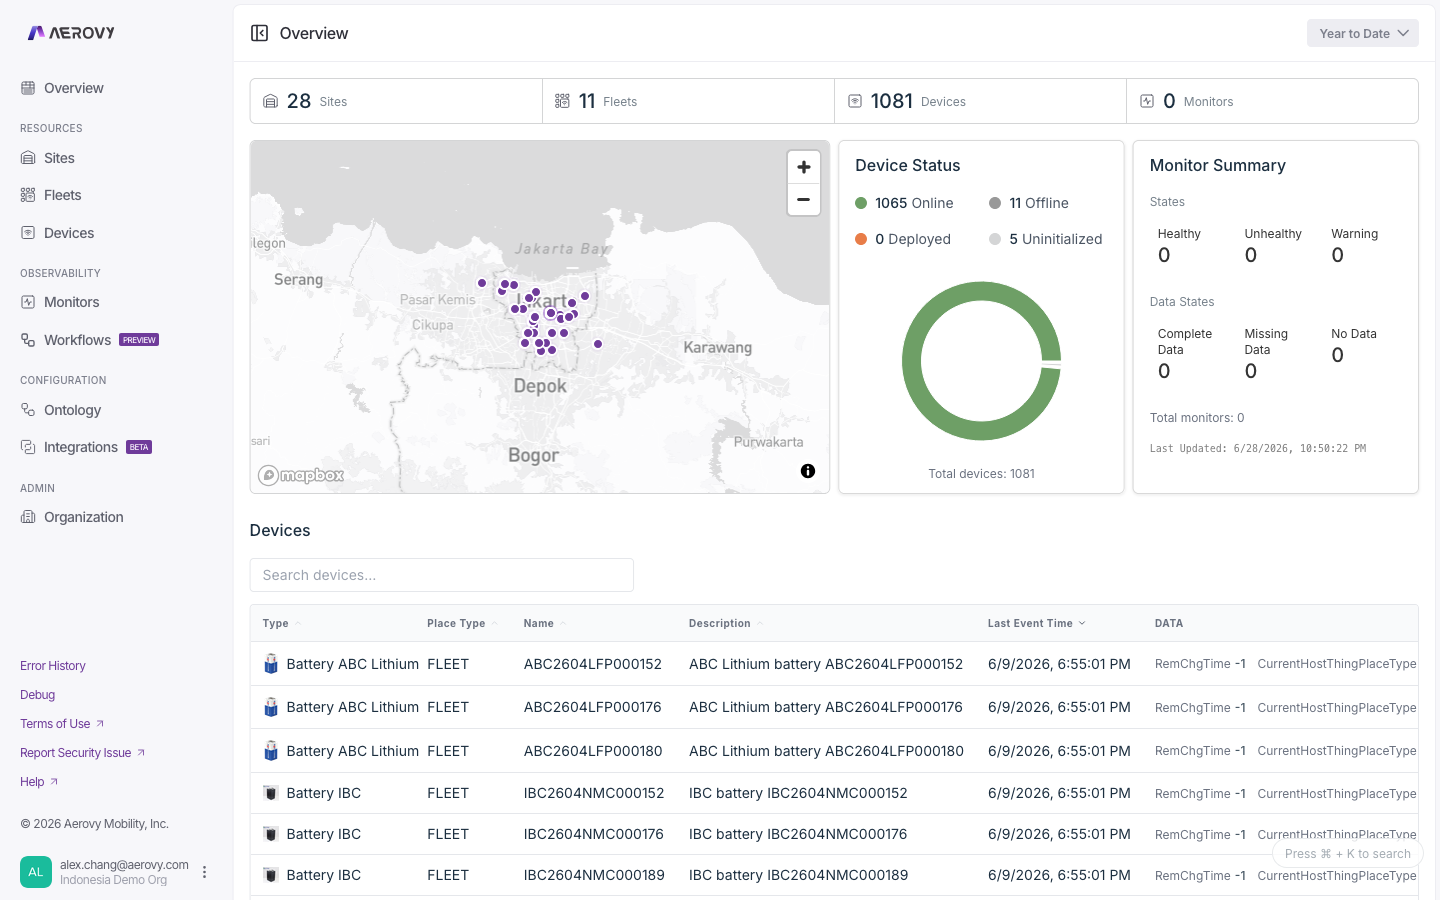
The Overview is the landing page of the console. It summarizes the health of everything in your organization: counts of sites, fleets, devices, and monitors, the location of your sites and fleets, a breakdown of devices by online state, monitor health and data coverage, and a list of every device.
A time-range selector sets the window for device state and, where enabled, transaction volume.
Configuration
Time range
Sets the window for device state and transaction volume.
| Option | Meaning |
|---|---|
| Past Day | Last 24 hours |
| Today | Since midnight |
| Yesterday | The previous day |
| Past Week | Last 7 days (default) |
| Year to date | Since Jan 1 |
| Custom range | Pick start and end, with a UTC / Local timezone toggle |
Devices table
Lists every device, sorted by most recent event first.
States
Device state
Each device resolves to one of four states from its last event time and reporting interval.
| State | Label in UI | Meaning |
|---|---|---|
online | Online | Last event arrived within the reporting interval |
offline | Offline | No event within the reporting interval |
unknown | Deployed | No reporting interval set, so freshness can't be judged |
uninitialized | Uninitialized | Device has never reported an event |
The reporting interval defaults to 60 minutes when the device doesn't define one. If device
data fails to load, every device falls back to Deployed (unknown).
Monitor health
The monitor summary card rolls every monitor up into two independent dimensions.
Health state
| State | Meaning |
|---|---|
HEALTHY | Condition is satisfied |
WARNING | Condition is in a warning band |
UNHEALTHY | Condition is breached |
Data state
| State | Meaning |
|---|---|
COMPLETE_DATA | All expected data is present |
MISSING_DATA | Some expected data is missing |
NO_DATA | No data is arriving |
The card also shows the total monitor count and the time the summary was last calculated.
API
The Overview only reads data (send your API key in the X-Api-Key header; a read scope
covers all of it).
- Device, site, and fleet counts come from the standard list endpoints (
GET /v2/things,GET /v2/sites,GET /v2/fleets) documented on the Devices, Sites, and Fleets pages. - Per-device online/offline state derives from each device's last event time
(
GET /v2/things/{thingId}/latest-event-time).
An org-wide monitor health and data-state summary endpoint is coming soon to the v2 API.
A Place's monitor count is available through GET /v2/sites/{placeId}/monitor/count and
GET /v2/fleets/{placeId}/monitor/count.